This blog is my trading diary. It is an attempt to organise my analysis and thoughts. I follow the charting methods given in JUST NIFTY blog by Ilango sir and so the charts would have striking resemblance to his charts. I am indebted to Ilango sir for having made this blog possible for me.

July 8, 2011

Analysis for July 8

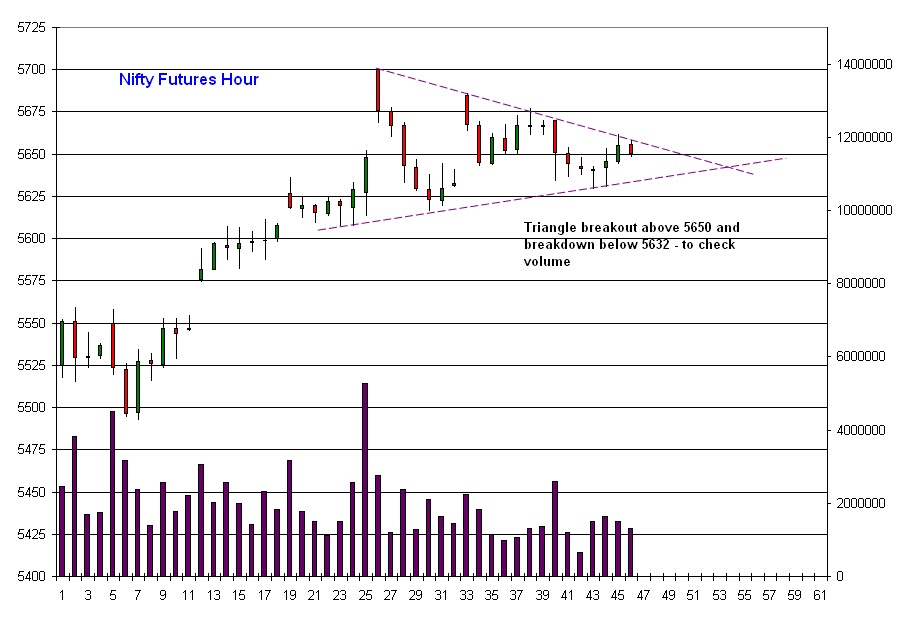
In weekly charts A Triangle is formed and Breakout would sustain the uptrend


Market has closed above all Hi ema's and Pivots exhibiting Strength. However the 200 DMA at 5745 is yet to be breached. A close above this today would lead to Big Upmoves keeping the uptrend intact. If resisted Intraday NS is likely to find support at 5678 Day HEMA.

Todays Close would be a decider for the current upmove.

.

July 7, 2011

Analysis for July 7

The Descending traingle formed in NS is still intact with range 5640 -5614. Yesterday It gave a minor break during opening but did not sustain and NS was dragged down to the support level.

Nifty still exhibits ST weakness by closing below the Day Hema, Week and Day Pivots. A close below the Day Lema at 5593 Would lead to more weakness.

If NS finds support at 5585 - 23.6% retr of the rise from 5197-5705, then an intraday bounce can be expected upto Day Hema of 5648. It would be wise not to hold any Short position (Short Term) with a breakout above 5650 as the 200 DMA 5745 is still in the reachable limits.

Todays Trading Range : Short below 5648 (DHema) with SL at 5655
                                      Long above 5605-10 with SL at 5580

Today's CAM levels:

July 6, 2011

Analysis for july 6

Strength: NS has closed above Week and Day 5EMA and above week Hema

Weakness : NS has closed below Day Hema and week (5641)and Day pivots (5635). It has closed below all Hour High ema of july 5th.

A Descending Triangle has developed in NS with breakout above 5640 and breakdown below 5612. The day trading range has narrowed and breakout is likely to lead Nifty to its 200 DMA 5745.
A breakdown and close below the DayLema of 5585 would lead NS to 50DMA at 5515.


The NF shows Symmetrical triangle pattern - Which can breakout on either side but NS shows Descending triangle pattern - which is Bearish

For more details about Triangles refer Link

July 5, 2011

Analysis for July 5

Strength : Nifty has closed above all High EMA except the month Hema

Weakness: NS has closed below Day Pivot and 5EMA  (5603) is below 5SMA(5614).

Today if  NS trades below the Pivot of 5654 and Closes below the Day Lema 5637 there will be Short term reversal else - the uptrend will continue. The 200 DMA is 5745 and Nifty is likely to get resisted at that juncture.

Supports could be found at 5605 - 5585 -5570 Day EMA and Week EMA.

July 4, 2011

Analysis for the Week& Month

Month 
  5705 the present high of july 1 is an important resistance and 5510and next 5400 is an  important support as per trendlines.

      
WEEK:

Week high ema is 5596 and pivot is 5585 = 23.6% retr for the uptrend 5197 - 5705
Week 5ema is 5523 and 5510 is 38.2% retr
Week lema = 5375 and trendline support is 5400

Holding the support of 5400 in weekly basis and breakout above 5750 in Closing basis Nifty is likely to target 6100++