
September 28, 2012
Analysis for Sept 28
Nifty is fixed within a very narrow trading range of 5640-5720. Now for Charts:

September 26, 2012
Analysis for Sept 26
Nifty Ended as a DOJI - depicting indecisiveness to move further. Trading Below Day Pivot - followed by trading below Day HEMA 5665 would indicate weakness. EOD close below Day LEMA 5600 would drag Nifty further down. But considering the expiry tomorrow - close below Day LEMA is doubtful as Bulls are comfortably placed this expiry.
NIFTY WEEKLY CHARTS:
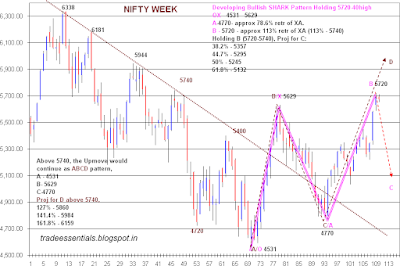
NIFTY WEEKLY CHARTS:

September 25, 2012
INTRADAY UPDATE SEPT 25
Update 1.00PM:
Booked aggressive Longs taken at 5660NS @ 5685NS .
A rising wedge is developing in Hour charts.
 Aggressive buy Intraday @ 5660NS SL - 5650NS.
Booked aggressive Longs taken at 5660NS @ 5685NS .
A rising wedge is developing in Hour charts.

Analysis for Sept 25
Nifty is correcting from the New Highof 5720. With three more trading sessions for expiry, bulls would not give up easily, and 5600NS is likely to be protected. If the Day Closes below the Day HEMA 5648, then it is likely to test 5600-5580 - Day LEMA.
Today's Channel supports are at 5630-20NS Channel Resistances - 5710-20

The Hour charts are also exhibiting -ve divergences - which indicates caution at High Levels.
Today's Channel supports are at 5630-20NS Channel Resistances - 5710-20

The Hour charts are also exhibiting -ve divergences - which indicates caution at High Levels.
September 24, 2012
Analysis for Sept 24
Nifty had a huge Runup and has closed near the 52 week High. Now to charts:
NIFTY WEEK LONG TERM CHART:
 Cluster of resistance at 5700 levels.
Considering the inverted H&S/Contracting triangle breakout - Nifty is likely to reach the CHANNEL TOP near 6100++ on taking out 5740 - previous High on a closing basis.
NIFTY WEEK LONG TERM CHART:

Considering the inverted H&S/Contracting triangle breakout - Nifty is likely to reach the CHANNEL TOP near 6100++ on taking out 5740 - previous High on a closing basis.