Intraday Update 3.00 pm:
INTRADAY and POSITIONAL shorts squared off.
INTRADAY UPDATE 1.30PM:
Shorted aggressively (for Intraday) at 5010 NS with SL Hour close above 5020 - 50 DMA.
AS expected NS opened with huge GAP up yesterday and has closed above the Day Hema but lower than Day Pivot. It has also closed well above the Week Lema but below the Week 5EMA. If NS manages to Close above the week 5EMA today then we could see more upsides.
| Week levels |
Developing levels
| ||
| CLOSE | 4710 | CLOSE | |
| PIVOT | 4741 | PIVOT | 4901 |
| HI EMA | 5132 | HI EMA | 5092 |
| LOW EMA | 4876 | LOW EMA | 4836 |
| 5 EMA | 4962 | 5 EMA | 4954 |
| 5 SMA | 5086 | 5SMA | 5001 |
| PrevHigh | 4874 | 10 EMA | 5014 |
| Prev Low | 4639 |
| CHECK LIST-DAY | |||
| CLOSE | 4937 | ||
| PIVOT | 4955 | 10EMA | 4865 |
| HI EMA | 4847 | 13EMA | 4887 |
| LOW EMA | 4754 | 26EMA | 4957 |
| 5EMA | 4853 | prev HI | 5011 |
| 5 SMA | 4827 | prev LOW | 4917 |
| 50DMA | 5017 | 20 DMA | 4988 |
| 100Hr MA | 4890 | 200 HrMA | 5049 |
A Reciprocal ABCD Harmonic pattern is Completed in the DAY Charts with the High of 5011 yesterday.
Reciprocal ABCD pattern:
Reciprocal AB=CD
The 5-0 pattern incorporates a new type of AB=CD measurement - a Reciprocal
AB=CD pattern. A Reciprocal AB=CD pattern is typically a shorter counter move of
equal length within a longer trend. They look like a lazy "Z" or "S."


The Reciprocal AB=CDs within the specific 5-0 structure are quite effective in defining a
precise area for a potential reversal. Although the 50% retracement is the most important
number at the pattern completion point, it is still essential to examine the entire range.
 As per the Pattern:
The Bearish RECIPROCAL ABCD pattern depicted in Hour Charts:

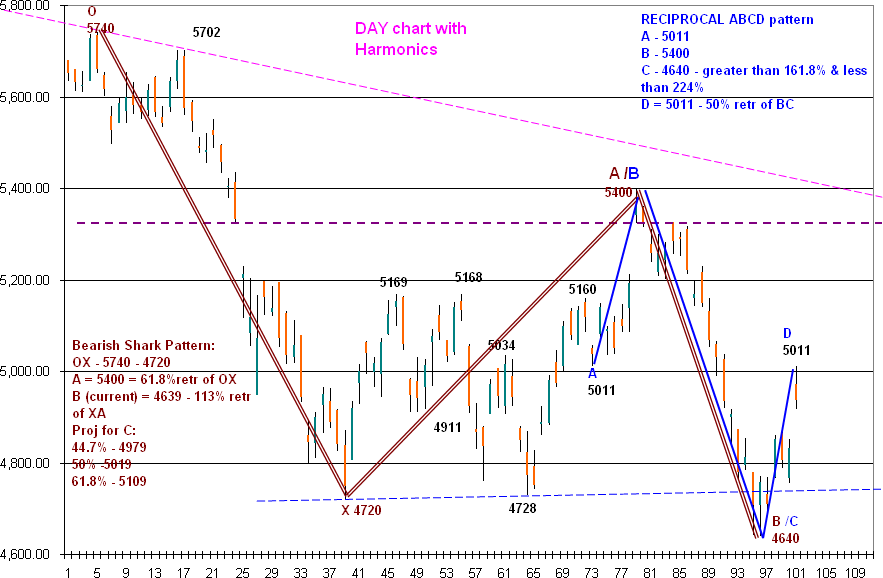
RECIPROCAL ABCD pattern
A - 5011
B - 5400
C - 4640 - greater than 161.8% & less than 224%
D = 5011 - 50% retr of BC
A - 5011
B - 5400
C - 4640 - greater than 161.8% & less than 224%
D = 5011 - 50% retr of BC
The 50% retr of BC to form D is very important.

The Fall from 5011 is indicated by the negative divergence formed in the above chart

The above chart shows the EW count in Hour Chart:
Alternate 1 -
wave 4 terminated at 5011 and 5.i has started.(a,b,c)
Alternate 2
the v.4c is yet to commence.
There is a cluster of resistances at,
4960 - 5020 by way of Week 5ema, week 5 SMaA, week 10 EMA and a move past all these resistances and a close above it would only result in further upmoves ELse the 5th wave down would be confirmed. Todays week Close is an important deciding factor.
| Trade Table | |||
| Current pattern | A-B | C | D(current) |
| Reciprocal ABCD Pattern DAY TF | 5011 - 5400 | 4640 | 5011 |
| Trade initiated | SL Close above 5020 | ||
| SOLD at 5005 NF | TGT Projected | ||
| 23.60% | 4923.00 | PP bkd @ 4940 NF | |
| 38.20% | 4869.00 | ||
| 44.70% | 4844.00 | ||
| 50.00% | 4825.00 | ||
| IMPORTANT TA parameters for projections | |
| 4923.00 | Prev Day Low |
| 4869.00 | 10 EMA |
| 4844.00 | Day HEMA |
| 4825.00 | week LEMA |
| If NS trades above 5011 then higher projections | ||
| Prev Low | 50.00% | 5019.00 |
| 200 Hr MA | 61.80% | 5109.00 |
| 50 DMA | 7070.00% | 5177.00 |
| 7860.00% | 5237.00 | |
7 comments:
Dear Satheesh ,
I am trying to plot the slow macd on the hour chart but am not able to plot them together on the same chart , they get plotted on different chats , will it be possible for you to briefly tell me the guidelines , as to how to do that . ALso the price marks are there on the left side , I want to take them to right side ..but unable to do so .
Kindly guide when you get time after market hours .
Many thanks and rgds
Smita
Smita,
The Primary axis is on the left side and the secondary axis on the right. By default the first data would take the primary axis and for the second data set you will get the option of choosing the axis.
the NS details has to be plotted using the Stock chart option. The Smacd must be plotted using the line chart. So give the first set of data for Smacd and then then the second set of data as OHLC of NS. when you give the second set of data choose the secondary axis instead of primary axis. Your problem will be solved.
DEAR SATISH, very simple n very nice explanaion. best wishes 4 happy n bright future.
Thanks ALBELA
Many thanks Satheesh , I will try it .
@Satheesh,
Risining wedge is intact or not?
What is the invalidation level of this rising wedge
Thanks Satheesh ,
I was finally able to do it , but did the OHLC on primary axis and S.Macd as line chart on secondary .
Rgds
Smita
Post a Comment