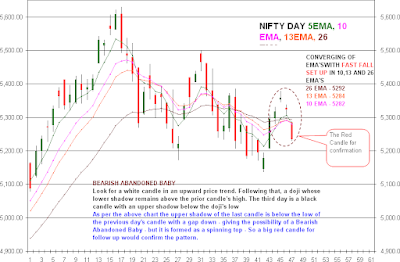
Below is the chart showing support levels of Nifty for this week
FIRST TRENDLINE SUPPORT - 5170 - 5180 - 200 DMA
TRIANGLE SUPPORT - 5100 - 5120 - 40 week MA
CHANNEL SUPPORT - 5050-5070 - 100 DMABreakdown below 5050 leads to 4950 levels -Month LEMA - 61.8% retracement for 4531 - 5629
The Bearish Shark Pattern will be invalidated below 5136 and it would form a Bullish ABCD again and would be labelled as:A-B- 5499-5136
C - 5379 - 61.8% OF AB
Proj for D:
113% - 5104
127% - 5070
161.8% - 4985
THE PROJECTIONS FOR D COINCIDES WITH THE SUPPORT LEVELS PROVIDED IN THE DAY CHART ABOVE.
AS THE HOUR IS OVERSOLD THERE MIGHT BE A BOUNCE FROM THE SUPPORT LEVELS OF 5180 -5200 INITIALLY OR THE 200 DMA -5151.
SO AN AGRESSIVE BUY CAN BE GENERATED AT THESE LEVELS WITH STRICT SL BELOW 200 DMA 5151.
| CHECK LIST-DAY | |||
| CLOSE | 5234 | 5 SMA | 5306 |
| PIVOT | 5250 | 5EMA | 5282 |
| HI EMA | 5314 | 10EMA | 5281 |
| LOW EMA | 5231 | 13EMA | 5284 |
| prev HI | 5288 | 26DEMA | 5292 |
| prev LOW | 5228 | 10 DMA | 5261 |
| 100 DMA | 5079 | 100 Hr MA | 5270 |
| 200 DMA | 5151 | 200 Hr MA | 5312 |


1 comment:
Hello Satheesh
nice to know that all is well in Chennai.
horrific memory of last Tsunami is still vivid in my mind
regards
Post a Comment