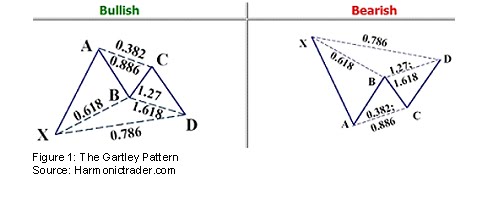
The harmonic patterns are basically identifying the movement of the Prices in a X,A,B,C,D geometric pattern combined with Fibonacci retracements.
The highlight of these patterns are the co-relation between the waves and the Fibonacci counting. Based on the retracements of wave XA to B, the patterns has been categorized as Gartley, Bat pattern, Butterfly Pattern and Crab Pattern. Another fact is that these patterns work under all Time Frames from minutes to week etc.,
Harmonic Patterns:
1. GARTLEY PATTERN
2. THE BUTTERFLY PATTERN

3. The Crab Pattern

4.The Bat Pattern:

In NIFTY the harmonic patterns are found to develop alternatively. To Complete a Bullish pattern, Bearish pattern develops and so on and so forth!! From the low of 4785, three alternate patterns have been identified in a very broad view, and the Harmony in them is really amazing!!
If one goes into details there are patterns developed with patterns.
In the chart shown below a small bearish Gartley is developed shown in double lines inorder to complete the CD wave (6181 -5177) of the Bullish Pattern
![]()

BULLISH BAT PATTERN:
WAVE XA = 4785 – 6338 = 1553.5 POINTS
B = 5690 approx 38.2% retracement of XA = 5745
Main criteria – greater than or equal to 38.2% and less then 50%
C = 6181 which is 76.4% retracment of AB = 6185
D = 5177 which is greater than 161.8% retr of CD and also 76.4% retr of the
first wave XA
The TARGET for this pattern are the Fibonacci retracement numbers from 38.2% onwards. This pattern has given a High of 5944 which is exactly 76.4% retracement of CD
![]()
In the Chart shown below, the CD of the Bullish pattern becomes the XA of the next pattern.

BEARISH BAT PATTERN:
Wave XA = 6181 – 5177 = 1004 pts
B = 5608 (approx equal to 38.2% of XA =5560 and less than 50% retr 5679)
C = 5348 (equal to 61.8% retracement of AB =5341)
D = 5944 (equal to 224% retr of BC and 76.4% of retracement of XA.
The target for this starts from 38.2% retracement of the last wave CD this pattern has initially provided a target of 5693 50% retr of the wave CD, and as D =5944 was not surpassed, a target of 94.43% retr (of CD = 5329) was achieved.
In the next case the previous CD has become the XA for the next bullish Pattern.

BULLISH BUTTERFLY/CRAB PATTERN:
Wave XA = 5348 – 5944 = 596 pts
B = 5693 (approx equal to 50% retr of XA = 5646)
C = 5912 approx equal to 88.6% of AB = 5915
D = 5329 approx equal to 261.8% of BC and approx equal to 94.3% retr of XA = 5381.2
The upmove got resisted at 38.2% retr of CD at 5605, and plummeted down to complete the Crab pattern at D=5197 approx equal to 361.8% .
In the present scenario, the previous CD from 5912 to 5197 (shown in red lines) becomes the Wave XA for the next bearish pattern possibility

BEARISH BUTTERFLY PATTERN
Wave XA = 5912 – 5197 = 715 points.
B = 5740 approx equal to 76.4% of XA
Current C = 5495 = approxequal to 50% retr of AB at 5468
If this C holds then the target for D would be at
1. 61.8% = 5646 achieved
2. 100% = 5740 = 76.4% of XA = 5743
3. 127% = 5806
For the pattern to complete, D must move near to B. Incase the upmove is resisted at the current levels, then a new low C can be formed at 61.8% retr of AB = 5404
1 comment:
hi sir,
can u suggesst me a software where i can auto scan all these patterns
Post a Comment