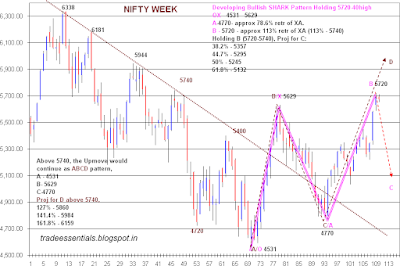
NIFTY WEEKLY CHARTS:
Developing Bullish SHARK Pattern Holding 5720-40high
OX - 4531 - 5629
A-4770- approx 78.6% retr of XA.
B - 5720 - approx 113% retr of XA (113% - 5740)
Holding B (5720-5740), Proj for C:
38.2% - 5357
44.7% - 5295
50% - 5245
61.8% - 5132
The 113% retr of the Leg 5629 - 4770 arrives at 5740. So an option of High of 5740 is still on cards. Cluster of Resistance (CLICK HERE) act in this Zone, where a Pause in upmove can be expected.
Above 5740, this pattern would be relabelled as an ABCD pattern with Projections upto 5850++
A - 4531
B- 5629
C-4770
Proj for D above 5740,
127% - 5860
141.4% - 5984
161.8% - 6159
Day Chart: CHANNEL SUPPORT 5660-50
CHANNEL RESISTANCE - 5710-15
HOUR CHARTS:
HOUR CHANNEL
Resistance - 5680-85
Support - 5645-40
SYNOPSIS:
Hold Shorts with SL 5715NS.
Aggressive Longs for Intraday can be attempted at either channel Bottom at 5640 with 10 point SL
Longs can be attempted at 5605-5610 levels based on Day LEMA with 15 Point SL 5592 being the developing Week HEMA.
| CHECK LIST-DAY | |||
| CLOSE | 5674 | HI EMA | 5666 |
| PIVOT | 5676 | LOW EMA | 5604 |
| prev HI | 5703 | 20 Hr MA | 5679 |
| prev LOW | 5652 | 50 Hr MA | 5620 |
| 5EMA | 5637 | 5 SMA | 5638 |
| 10EMA | 5570 | 10 DMA | 5563 |
| 13EMA | 5539 | 20 DMA | 5426 |


No comments:
Post a Comment