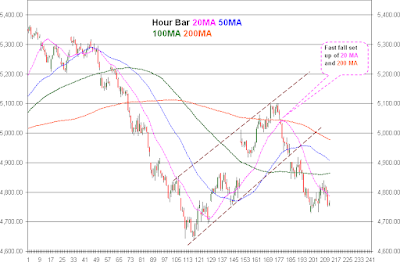
When the moving averages converge the smaller moving averages and the higher moving averages tend to fall in an order.
When the order of higher moving average to the lower moving average is in a descending manner then the probability of fast fall is very high and the invalidation point will be the smaller moving above the larger moving average and subsequently say in this eg - BNF trading above the highest Moving average.
FAST fall in Nifty Spot Hour:
In the above chart the 20Hour MA was moving towards the 200 MA but could not move past it which resulted in a fast fall.
Consider the below table.:
| DATE/TIME | OPEN | HIGH | LOW | CLOSE | 20 | 200 |
| 05/12/2011 10:00 | 5,036.50 | 5,049.45 | 5,017.80 | 5,022.45 | 4,933.57 | 5,046 |
| 05/12/2011 11:00 | 5,022.55 | 5,032.75 | 5,015.05 | 5,024.25 | 4,945.37 | 5,045 |
| 05/12/2011 12:00 | 5,024.60 | 5,029.75 | 5,002.55 | 5,012.15 | 4,955.31 | 5,045 |
| 05/12/2011 13:00 | 5,012.25 | 5,047.10 | 5,012.05 | 5,042.80 | 4,965.50 | 5,044 |
| 05/12/2011 14:00 | 5,042.75 | 5,055.20 | 5,013.40 | 5,019.55 | 4,975.67 | 5,044 |
| 05/12/2011 15:00 | 5,019.65 | 5,050.25 | 5,019.45 | 5,034.85 | 4,985.81 | 5,044 |
| 05/12/2011 16:00 | 5,035.15 | 5,045.75 | 5,032.85 | 5,039.15 | 4,989.22 | 5,044 |
| 07/12/2011 10:00 | 5,050.10 | 5,097.10 | 5,032.65 | 5,091.50 | 4,995.90 | 5,044 |
| 07/12/2011 11:00 | 5,091.50 | 5,091.85 | 5,078.50 | 5,088.10 | 5,002.32 | 5,044 |
| 07/12/2011 12:00 | 5,088.00 | 5,091.35 | 5,054.60 | 5,065.05 | 5,006.99 | 5,044 |
| 07/12/2011 13:00 | 5,065.25 | 5,087.95 | 5,060.20 | 5,081.35 | 5,013.95 | 5,044 |
| 07/12/2011 14:00 | 5,081.50 | 5,099.20 | 5,066.10 | 5,093.90 | 5,022.08 | 5,044 |
| 07/12/2011 15:00 | 5,093.75 | 5,099.05 | 5,068.20 | 5,072.10 | 5,028.84 | 5,044 |
| 07/12/2011 16:00 | 5,072.20 | 5,078.95 | 5,044.25 | 5,062.60 | 5,035.32 | 5,044 |
| 08/12/2011 10:00 | 5,037.40 | 5,048.90 | 5,027.75 | 5,029.85 | 5,039.75 | 5,043 |
| 08/12/2011 11:00 | 5,029.85 | 5,032.70 | 4,979.95 | 4,982.45 | 5,041.15 | 5,043 |
| 08/12/2011 12:00 | 4,982.55 | 4,987.50 | 4,939.00 | 4,967.95 | 5,041.15 | 5,043 |
| 08/12/2011 13:00 | 4,967.75 | 4,971.20 | 4,955.20 | 4,967.05 | 5,038.77 | 5,042 |
| 08/12/2011 14:00 | 4,967.25 | 4,985.55 | 4,942.85 | 4,961.15 | 5,035.42 | 5,041 |
| 08/12/2011 15:00 | 4,960.75 | 4,965.30 | 4,926.40 | 4,932.00 | 5,029.51 | 5,040 |
| 08/12/2011 16:00 | 4,932.10 | 4,963.85 | 4,921.65 | 4,943.65 | 5,025.57 | 5,039 |
| 09/12/2011 10:00 | 4,870.75 | 4,901.90 | 4,843.85 | 4,901.35 | 5,019.43 | 5,038 |
| 09/12/2011 11:00 | 4,901.45 | 4,901.70 | 4,864.70 | 4,879.50 | 5,012.80 | 5,037 |
From 5035 the 20 MA tried to reach the 200 MA at 5044. Then the 20 MA was 5041.15 and the 200 MA was 5043. the 20 MA could not surpass the 200 MA which resulted in fast fall.


5 comments:
Hi Satheesh
thanks for clarity on fast fall/rise setup
i am from JN of Ilango Sir
i was seeking for your help there on the subject
best of regards
Thanks Parimal.
Hi Satheesh
for fast fall/rise setup, you are using not just one but different combinations, why so? and which one do you find more reliable? above you have given the chart of 20 and 200 sma.
your kind clarification will be highly appreciated
regards
Parimal,
For 5min charts when trades are initiaed based on a range of MA's helps avoiding whipsaws. Also I always keep the base as 100MA or 200 MA. Such trades are successful 80%of the time.
Whereas in Hour charts any any two MA's would give the desired result. But as given in the above example when the lowest MA (20 MA) gets a fast fall/fast rise setup with the highest MA (200 MA), then the effect would be huge - as you could see in this case you can see that NS has moved from 5032 till 4700 today!!
Hello Satheesh, thanks for the kind and enlightening lesson
kind regards
Post a Comment