This blog is my trading diary. It is an attempt to organise my analysis and thoughts. I follow the charting methods given in JUST NIFTY blog by Ilango sir and so the charts would have striking resemblance to his charts. I am indebted to Ilango sir for having made this blog possible for me.

September 22, 2023

NIFTY ANALYSIS 22 SEPT 2023

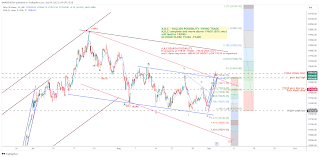
 From the high of 20222 Nifty has retraced up to 0.5% Fibo retracement@19704 -  This corresponds to Hour 200 EMA and aslo +ve divergence seen in 14RSI charts in Hour, 15min and 5 min TF. A pause likely here towards 19900 but with an Hour close below 19690 - down pressure would be imminent.

Prev Day

high - 19848

low - 19704

close - 19742

Intraday Levels for trading

Buy above 19745 - with SL below 19690 

Sell below 19690 with 15 min close above19705


September 11, 2023

NIFTY ANALYSIS FOR 11th SEPT

 Recap of 8th Analysis and trade:

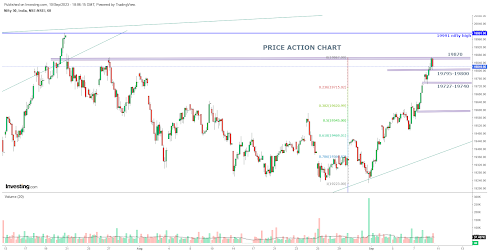
Nifty was supported @ 19725 and on breakout of 19740 - reached a high of 19867 - 78.2% retracement and cluster resistance and closed @ 17819.

Trades taken:

Bought 19700 CE on breakout of 19740 and squared off @ nifty spot 19850 levels  - one good trade done

NIFTY ANALYSIS FOR 11TH SEPT 2023:

Prev Day:

High - 19867

low - 19727

Close - 19819


Nifty has reached the cluster resistance & 78.2 Fibo ratio @ 19687. RSI charts shows -ve divergence.

A pause likely till 19870 is taken out. Fibo retracements to be watched below 19800.

INTRADAY LEVELS:

Bullish above 19870 towards Nifty prev high 19991

Bearish if resisted @ 19870 and below 19800 - drag towards 19720 levels. 

PRICE ACTION LEVELS:

19870

19795

19740-19725


September 8, 2023

NIFTY ANALYSIS FOR 8th SEPT 2023

 RECAP OF 8TH ANALYSIS AND TRADE:

Nifty supported @ 19550 ( price action levels) & crossed cluster resistance levels @ 19637 and rallied up to 19737. 

Trades taken:

Bought 19550 call and 19600 call on 15 min close above 19637 and squared off Intraday - very good trade done.

NIFTY ANALYSIS FOR 9TH SEPT:

Prev Day

HIGH - 19737

LOW - 19550

CLOSE - 19727

Nifty just crossed the 61.8% fibo ratio @ 19697. A pause likely at golden ratio. A move past 19740 - will target the next swing high of 19798 - 19825 - corresponding to 78.2% fibo ratio and the Channel resistance.

INTRADAY LEVELS:

BULLISH ABOVE 19740 - towards 19798-19825

BEARISH below 19690 -19640 (50% retr of 19550 - 19737) -19605

PRICE ACTION LEVELS:

19740

19690

19640

19605


September 7, 2023

NIFTY ANALYSIS FOR 7th SEPT 2023

 RECAP & TRADES OF 6TH SEPT:

Nifty resisted at 19600 - and made a low of 16502. Supported @ 19490-500 levels breakout above 19530 a swift move towards 19600 ++ As per price action

Trades :

BOUGHT 19600 PE @ 70 & squared off @ 110 - One good trade DONE

Bought a 19450 CE @ 72 and squared off @ 106... Another good trade.

NIFTY ANALYSIS FOR 7th SEPT:

Prev Day:

HIGH -19636

LOW - 19491

CLOSE - 19611

OUTSIDE CANDLE FORMED

CLUSTER RESISTANCE @ 19630 LEVELS.

50% RETR OF  19991 -19223  REACHED -19610 LEVELS

A RISING WEDGE PATTERN IS SEEN 

GAP RESISTANCE @ 19680 -19700 - @ 61.8%  FIBO LEVELS


INTRADAY LEVELS:

BULLISH : Above19630 - 19680 -19710 - (filling of gap)

BEARISH : Below 19630 - 19540 (rising wedge support) -19510 -19500

PRICE ACTION LEVELS: WIDE RANGE - implies high volatility expiry

19630

19540

19490


September 6, 2023

NIFTY ANALYSIS FOR 6th Sept 2023

 RECAP OF 5TH SEPT ANALYSIS AND TRADE:

Nifty opened above the prev day high of 19545 and resisted at swing high of 19587 and retraced 38.2% of the prev rise of  19432 - 19587 - to respect the price action level of 19520 - by forming today's low @ 19525.

Trade 1 done : bought 19500CE  @ 85 and sold @ 97

Trade 2 done : bought 19600PE @ 80.95 and sold @ 70 - Mistake done by not booking at the price action level of 19520 - as mentioned in the analysis and waited for further downside - thereby missing earlier gains too. 

5th Sept - No loss No Gain - 😐


ANALYSIS FOR 6TH SEPT:

Prev Day - 

Open 19564

High - 19587

low - 19525

Close - 19574

50DMA - 19463 

Again a DOJI formed. 

INTRADAY LEVELS:

Intraday Bullish levels: Cluster of resistances at 19590-19600 levels. On sustainable breakout above 19590 -19600 Nifty is likely to target 19640 - 19700. 

Intraday Bearish Levels: If resisted  @ 19580 levels - then 19525 - below which 19430 levels

PRICE ACTION LEVELS :

19595 - Cluster resistance

19575 - prev day close

19525 - prev day low

19500 - 5min 200 EMA & 23.6% fibo retracement


September 5, 2023

NIFTY ANALYSIS 5 SEPT 2023


Nifty values for 5th September 2023


Prev Day

High – 19545

Low – 19432

Close – 19528

DOJI FORMATION

Intraday Bullish possibilities:

Move above 19545 – next swing high – 19584-19600 – corresponds to 50% retr of the wave 19991 – 19223.


Intraday Bearish possibilities:

Break below channel – 19495 –

T1 – 19432 – prev day low

Hourly close below 19430 – will weaken further as week’s close is breached and a move below 19430 – SL -15 min close above 19440.


PRICE ACTION LEVELS TO WATCH:

19600

19545

19495

19430


December 13, 2022

NIFTY ANALYSIS


Nifty had a sharp recovery from the low of 18345 towards 18500 + and has closed @ 18495.

An a,b,c  seems to have completed @ 18345  - retracing approx 61.8% retracement of 18133 – 18886.


PRICE ACTION:

Above 18520 – levels to watch as per fibo retracement – of the fall from 18886 – 18345.

 18550 – 38.2%

 18615 – 50%

 18670 – 61.8%


BELOW 1420 – and break of 18400 – nifty would be dragged towards 18300 levels.

SUPPORT AND RESISTANCE:

Nifty closed at 21 DMA @ 18495

10 DMA - 18639.

INTRADAY TRADE PLAN:

BUY ABOVE (BUY 18500 CAL) 18520 SL 15 MIN CLOSE BELOW 18500

SELL BELOW (BUY 18400 PUT) 18400 - SL 15 MIN CLOSE ABOVE 18425