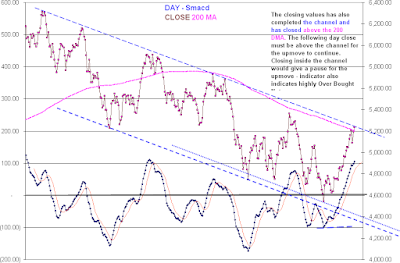
Nifty Closed with a doji depicting indecisiveness. Protecting 200DMA and Day 5 EMa at 5200, more upsides beyond 5300++ is possible. The developing Weekly Pivot at 5210 also provides good supports.
WEEKLY CHART:
The Long term TRENDLINE is breached in weekly charts and sustaining above the trendline is a must for further upmoves.
DAY CHART:
The Negative Divergence developed in day charts is to be noted:
HOUR CHART: If a fall is supported at the trendline another high is possible approximately near the DAY 5EMA @ 5204 - corresponding to 200 DMA.
A close below this would lead to more corrections.Supported here would take Nifty to 5300 ++
LEVELS TO BE NOTED FOR TODAY:
5285 -5300 - RESISTANCES
5200-5210 - SUPPORTS
| Week levels | Developing week levels | ||
| CLOSE | 5205 | CLOSE | |
| PIVOT | 5148 | PIVOT | 5212 |
| HI EMA | 5031 | HI EMA | 5118 |
| LOW EMA | 4816 | LOW EMA | 4903 |
| 5 EMA | 4984 | 5 EMA | 5029 |
| PrevHigh | 5217 | 5 SMA | 4831 |
| Prev Low | 5021 | High | 5290 |
| 40 Wk MA | 5170 | LOW | 5077 |
| CHECK LIST-DAY | |||
| CLOSE | 5270 | ||
| PIVOT | 5262 | 5 SMA | 5198 |
| HI EMA | 5223 | 5EMA | 5204 |
| LOW EMA | 5152 | 10EMA | 5106 |
| prev HI | 5290 | 13EMA | 5100 |
| prev LOW | 5226 | 26EMA | 4999 |
| 20 DMA | 4992 | 20 Hr MA | 5157 |
| 200 DMA | 5201 | 50 Hr MA |
5115
|
POSITIONAL LONGS CAN BE TAKEN IF THE DAY CLOSE IS ABOVE 5200 NS.


