This blog is my trading diary. It is an attempt to organise my analysis and thoughts. I follow the charting methods given in JUST NIFTY blog by Ilango sir and so the charts would have striking resemblance to his charts. I am indebted to Ilango sir for having made this blog possible for me.

September 8, 2023

NIFTY ANALYSIS FOR 8th SEPT 2023

 RECAP OF 8TH ANALYSIS AND TRADE:

Nifty supported @ 19550 ( price action levels) & crossed cluster resistance levels @ 19637 and rallied up to 19737. 

Trades taken:

Bought 19550 call and 19600 call on 15 min close above 19637 and squared off Intraday - very good trade done.

NIFTY ANALYSIS FOR 9TH SEPT:

Prev Day

HIGH - 19737

LOW - 19550

CLOSE - 19727

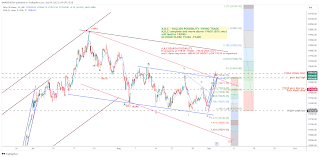
Nifty just crossed the 61.8% fibo ratio @ 19697. A pause likely at golden ratio. A move past 19740 - will target the next swing high of 19798 - 19825 - corresponding to 78.2% fibo ratio and the Channel resistance.

INTRADAY LEVELS:

BULLISH ABOVE 19740 - towards 19798-19825

BEARISH below 19690 -19640 (50% retr of 19550 - 19737) -19605

PRICE ACTION LEVELS:

19740

19690

19640

19605


September 7, 2023

NIFTY ANALYSIS FOR 7th SEPT 2023

 RECAP & TRADES OF 6TH SEPT:

Nifty resisted at 19600 - and made a low of 16502. Supported @ 19490-500 levels breakout above 19530 a swift move towards 19600 ++ As per price action

Trades :

BOUGHT 19600 PE @ 70 & squared off @ 110 - One good trade DONE

Bought a 19450 CE @ 72 and squared off @ 106... Another good trade.

NIFTY ANALYSIS FOR 7th SEPT:

Prev Day:

HIGH -19636

LOW - 19491

CLOSE - 19611

OUTSIDE CANDLE FORMED

CLUSTER RESISTANCE @ 19630 LEVELS.

50% RETR OF  19991 -19223  REACHED -19610 LEVELS

A RISING WEDGE PATTERN IS SEEN 

GAP RESISTANCE @ 19680 -19700 - @ 61.8%  FIBO LEVELS


INTRADAY LEVELS:

BULLISH : Above19630 - 19680 -19710 - (filling of gap)

BEARISH : Below 19630 - 19540 (rising wedge support) -19510 -19500

PRICE ACTION LEVELS: WIDE RANGE - implies high volatility expiry

19630

19540

19490


September 6, 2023

NIFTY ANALYSIS FOR 6th Sept 2023

 RECAP OF 5TH SEPT ANALYSIS AND TRADE:

Nifty opened above the prev day high of 19545 and resisted at swing high of 19587 and retraced 38.2% of the prev rise of  19432 - 19587 - to respect the price action level of 19520 - by forming today's low @ 19525.

Trade 1 done : bought 19500CE  @ 85 and sold @ 97

Trade 2 done : bought 19600PE @ 80.95 and sold @ 70 - Mistake done by not booking at the price action level of 19520 - as mentioned in the analysis and waited for further downside - thereby missing earlier gains too. 

5th Sept - No loss No Gain - 😐


ANALYSIS FOR 6TH SEPT:

Prev Day - 

Open 19564

High - 19587

low - 19525

Close - 19574

50DMA - 19463 

Again a DOJI formed. 

INTRADAY LEVELS:

Intraday Bullish levels: Cluster of resistances at 19590-19600 levels. On sustainable breakout above 19590 -19600 Nifty is likely to target 19640 - 19700. 

Intraday Bearish Levels: If resisted  @ 19580 levels - then 19525 - below which 19430 levels

PRICE ACTION LEVELS :

19595 - Cluster resistance

19575 - prev day close

19525 - prev day low

19500 - 5min 200 EMA & 23.6% fibo retracement


September 5, 2023

NIFTY ANALYSIS 5 SEPT 2023


Nifty values for 5th September 2023


Prev Day

High – 19545

Low – 19432

Close – 19528

DOJI FORMATION

Intraday Bullish possibilities:

Move above 19545 – next swing high – 19584-19600 – corresponds to 50% retr of the wave 19991 – 19223.


Intraday Bearish possibilities:

Break below channel – 19495 –

T1 – 19432 – prev day low

Hourly close below 19430 – will weaken further as week’s close is breached and a move below 19430 – SL -15 min close above 19440.


PRICE ACTION LEVELS TO WATCH:

19600

19545

19495

19430