This blog is my trading diary. It is an attempt to organise my analysis and thoughts. I follow the charting methods given in JUST NIFTY blog by Ilango sir and so the charts would have striking resemblance to his charts. I am indebted to Ilango sir for having made this blog possible for me.

Showing posts with label Channels. Show all posts

December 6, 2022

NIFTY ANALYSIS

NIFTY broke the previous day low and the fifth wave was done at 18590 and from thereon  was a 100+ point move till 18700++ and managed to close at 18700.

Considering wave A as 18886 - 18590 - the ongoing 'B" is likely to retrace upto 18750 - 18775 - a 50% to 61.8% retracement - holding 18625.

INTRADAY TRADE SETUP:


There are cluster of resistances  @ 18720-730

*18717 - 15 min Bollinger band resistance

* 18728 - prev day high

*Channel resistance @ 18725

Break of 18625 - Channel resistance would drag Nifty lower towards 18500 - 50% of the retracement of the move from 18133 - 18886.

So, trading above 18728 - will lead towards 18750 -18775

& break below 18630 - will drag toard 18550 - 18520

Trade Plan :

Buy (call option) above 18725 Sl 15 min close below 18700 - (fall back into channel)

Sell below (buy put option) 18630 SL 15 min close above 18650 ( back into channel)


August 6, 2015

BANK NIFTY ANALYSIS

Intraday Update 2.00 PM

The Diamond pattern became a busted pattern and again today support well found at 18830 - SPOT levels.
19050 spot- knocking for the fourth consecutive day - CAUTION with SHORTS.


August 3, 2015

BANK NIFTY ANALYSIS

Intraday UPDATE: 1.00 pm:


Reached Channel Resistance at 19000 spot- Corresponding to 80% retracement of 18174 - 19019 (present High). Breakout and EOD close above this will be Highly Bullish.

On resistance must watch the Fibo retracement along with the MOVING AVERAGES.

FIBONACCI RETRACEMENT FOR 18174 - 19019: 

38.20% 18696  20 DMA
44.70% 18641
50% 18596  10 DMA
61.80% 18496

TRADE PLAN: 

Book Longs as mentioned in Premarket view and Initiate Shorts with SL EOD close above 19050. On EOD close above 19050 - convert to POSITIONAL LONGS.

July 28, 2015

BANK NIFTY ANALYSIS

PRE-MARKET:

Bank Nifty has fallen upto 50% from the rise of 17174 - 19229. Holding 18200 EOD and breakout above 18350-400 will result in an upmove. If Resisted at 18400 - then again a fall towards 18200 - break of which would drag BN towards 17900-17800.

50 DMA is 18330 and 200 DMA is 18300 - a FAST RISE set up is prevailing - On an EOD close above 18300 - it will  come into play very effectively.


Trade Plan for today:
INTRADAY -
Buy above 18200 Sl 18150 Hour Close targets - 18350-400 spot values. If two Hour close above 18350 - then trail SL to 18350 CLOSE and hold the LONGS.

Sell below 18200 - SL Hour close above 18250 - targets 1800/17950/17800


May 19, 2014

Tatamotor Analysis

Tatamotors has reached a High of 465 and is attempting a pull back.

WEEKLY CHARTS have given a breakout.


May 5, 2014

TATAMOTOR ANALYSIS

FOR NIFTY ANALYSIS CLICK HERE

Tatamotors made a High of 337 and has had a pull back up to 404 - 50 DMA.

It is trading between 50 DMA and 10 DMAduring the past week.

Trading  above 414-415 - 5 DMA and an EOD close above 5DMA would give a runup towards 10 DMA again.

Failing to close below 5DMA - would drag tatamotors near 404-405 50 DMA again.

A Bearish Wolfe Wave has formed in Day Charts which would be invalidated on an EOD close above 10 DMA 420-422.


January 24, 2014

NIFTY ANALYSIS

FOR TATAMOTORS ANALYSIS CLICK HERE

Nifty after a good run-up upto 6355 - is now at a Make or Break level. Holding 6300 - especially on EOD/EOW basis is very important.

Break below 6300 - is weakness as per Day TF
Support at 6250 - is must for upmove as per Week and Month TF's


January 9, 2014

NIFTY ANALYSIS

TATAMOTORS ANALYSIS CLICK HERE:
Nifty has closed EOD below the 50 DMA and Day LEMA for the past three days - signalling weakness
 Moving past 50 DMA and at least 2 hrs close above 6200 would give strength for upmove else downsides continues.
Break below 6150 - weekly support - it is likely to be a swift fall.

DAY VALUES
HIGH 6192 5 EMA 6197
LOW 6160 10 EMA 6219
CLOSE 6175 5 DMA 6192
HI EMA 6234 50 DMA 6192
LEMA 6178

January 3, 2014

Nifty ANALYSIS

Nifty Dropped heavily from 6358 and has made a low of 6175 till now. The Weekly channel has broken down - which is likely to lead to more falls.

 EOD belowWeek LEMA - (6161 - with present low of 6171 - would change if another low is made)  would weaken Nifty Further. An EOW above week LEMA possibly would prevent a swift fall.

50DMA is at 6190 - which may lend a support for the time being. EOD close below 50 DMA would weaken Nifty Further.

December 9, 2013

The POWER of TECHNICALS !!!! - NIFTY at New High!!!!

Nifty has made an all time high of 6415.25 today. Give it any reason - congress failure-BJP victory etc etc...., Technically Nifty was all set for new Highs - well enough to believe all events are factored in prices.

Nifty has reached the Channel top in Monthly charts:


Nifty has reached the Broadening triangle resistance in weekly charts.

December 6, 2013

Nifty Analysis

Nifty Closed above all Hi EMA's and LEMA's except for Hour HiEMA.

DAY VALUES
HIGH 6301 5 EMA 6189
LOW 6232 5 DMA 6200
CLOSE 6241 10 DMA 6132
HI EMA 6229 20 DMA 6115
LEMA 6169 34 Hr MA 6208

December 5, 2013

Nifty Analysis

Nifty closed below all HEMA's but above all LEMA's indicating sell on rises in all TF's.

DAY VALUES      
HIGH 6209 5 EMA 6163
LOW 6150 5 DMA 6170
CLOSE 6161 10 DMA 6107
HI EMA 6193 20 DMA 6113
LEMA 6137 34 Hr MA 6177


Nifty also closed at the channel support, and if respected would make a swift move upto channel top at 6260-70 levels.


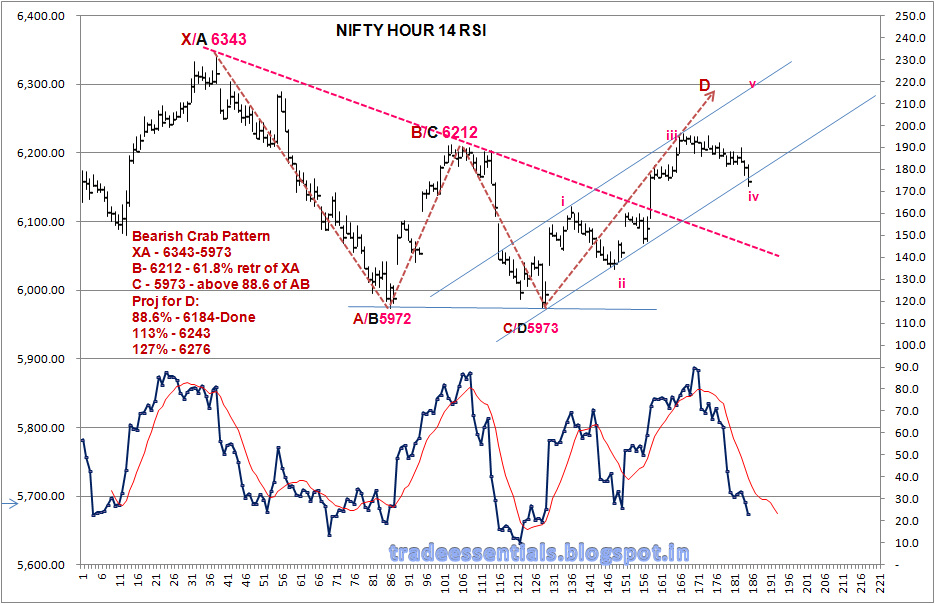
Similarly in Hour chart too, the channel support is evident. Channel resistance coinciding with the targets(last leg CD) of the  Bearish Crab pattern developed.


Bearish Crab Pattern
XA - 6343-5973
B- 6212 - 61.8% retr of XA
C - 5973 - above 88.6 of AB
Proj for D:
88.6% - 6184-Done
113% - 6243
127% - 6276
Extended targets -

141.40% 161.80%
6310.95 6359.70


TRADE STOPLOSS REASON FOR Stoploss
Bought at 6050NS on 26/11 EOD close below 6130 Day LEMA/5Week SMA
Part booked at 6180NS/6225NF on 29/11/13    
Book profits at 6280 - 6290-6300levels - near day / weekly channel resistance


December 4, 2013

NIFTY ANALYSIS

Though Nifty has closed above all the Day TF parameters, it could not breakout from the resistance of 6225-6230 levels.

December 2, 2013

NIFTY ANALYSIS


Nifty reached the Weekly Channel resistance and was not able to move past it and closed just near the resistance and below week HEMA. This might put a pause in the uptrend but considering the Weekly candle - it is a MARUBOZU (CLICK HERE) - which is Highly Bullish.

DAY VALUES      
HIGH 6183 5 EMA 6109
LOW 6104 5 DMA 6100
CLOSE 6176 10 DMA 6101
HI EMA 6132 20 DMA 6128
LEMA 6066 200 Hr MA 6151

Week Values  
HIGH 6183
LOW 6030
CLOSE 6176
HI EMA 6198
LEMA 6007
5SMA 6137
5EMA 6108

November 29, 2013

Nifty Analysis

INTRADAY UPDATE 11.00 AM:
Nifty has reached the weekly channel resistance @ 6182.6 - current high. partbooking as mentioned earlier is done. Holding the rest with a trailing SL with Current Day HEMA and 20 DMA @ 5130 levels.


TRADE STOPLOSS REASON FOR Stoploss
Bought at 6050NS on 26/11 EOD close below 6130 20DMA/Day HEMA/5Week SMA
Part booked at 6180NS/6225NF    


Nifty high at weekly Channel resistance

November 28, 2013

NIFTY ANALYSIS

For the past two days Nifty has held on to the support of 6030 levels-Week channel, Day LEMA and 50 DMA Support and has closed above it.
Today's Support Level - 6000-6020 - 20pts +or- Day LEma
Today's resistance Level -6140-50 - 20 DMA
Break below 6000 would be a swift fall.


November 26, 2013

NIFTY Analysis

Intraday Update at 3.15pm:
Nifty could be Bought at today's low levels 6050 -with SL 50DMA -6040 - as Nifty is likely to close above day LEMA. Today niftys' journey has been from Day HEMA to Day LEMA.

NIFTY ANALYSIS:
The low of 5970 was held and Nifty has given a bounce back of 100+ points. Now for few charts.

WEEKLY CHART:

Nifty has taken the channel support and is heading towards the channel resistance @ 6180-90 - coinciding with the CURRENT MONTH HEMA - being very crucial as this week end is month end too.


November 24, 2013

NIFTY ANALYSIS for the WEEK

Nifty has closed at a critical juncture of 5970 levels as per monthly charts. It has retraced upto the junction of support lines again. 5900 is the maximum support for further upsides. Break of 5900-5860 levels would be disastrous - as supported by Day charts


Nifty has closed the week making a double bottom at 5972 supported by Day channel.

September 13, 2013

NIFTY ANALYSIS

The Three Drive pattern (CLICK HERE) completed  by falling short of 40 points of its final target 161.8% 5084 - stopping at 5118. It has given quite a decent rally of around 800+ points to reach  a high of 5932.